ggplot2()函數(shù)
ggplot2是一個(gè)強(qiáng)大的作圖工具,它可以讓你不受現(xiàn)有圖形類型的限制,創(chuàng)造出任何有助于解決你所遇到問題的圖形。
qplot()
qplot()屬于ggplot2(),可以理解成是它的簡化版本。
qplot 即“快速作圖”(quick plot),顧名思義,能快速對(duì)數(shù)據(jù)進(jìn)行可視化分析。它的用法和R base包的plot函數(shù)很相似。
qplot()
參數(shù)
qplot(x, y = NULL, ..., data, facets = NULL,
margins = FALSE, geom = "auto", stat = list(NULL),
position = list(NULL), xlim = c(NA, NA),
ylim = c(NA, NA), log = "", main = NULL,
xlab = deparse(substitute(x)),
ylab = deparse(substitute(y)), asp = NA)
各項(xiàng)參數(shù)詳解
1.x, y:變量名
2.data: 為數(shù)據(jù)框(data.frame)類型;如果有這個(gè)參數(shù),那么x,y的名稱必需對(duì)應(yīng)數(shù)據(jù)框中某列變量的名稱
3.facets: 圖形/數(shù)據(jù)的分面。這是ggplot2作圖比較特殊的一個(gè)概念,它把數(shù)據(jù)按某種規(guī)則進(jìn)行分類,每一類數(shù)據(jù)做一個(gè)圖形,所以最終效果就是一頁多圖
4.margins: 是否顯示邊界
5.geom: 圖形的幾何類型(geometry),這又是ggplot2的作圖概念。ggplot2用幾何類型表示圖形類別,比如point表示散點(diǎn)圖、line表示曲線圖、bar表示柱形圖等。
6.stat: 統(tǒng)計(jì)類型(statistics),這個(gè)更加特殊。直接將數(shù)據(jù)統(tǒng)計(jì)和圖形結(jié)合,這是ggplot2強(qiáng)大和受歡迎的原因之一。
7.position: 圖形或者數(shù)據(jù)的位置調(diào)整,這不算太特殊,但對(duì)于圖形但外觀很重要
8.xlim, ylim, 設(shè)置軸的上下限
9.xlab, ylab, 在x,y軸上增加標(biāo)簽
10.asp: 圖形縱橫比
qplot做散點(diǎn)圖
使用向量數(shù)據(jù)
plot函數(shù)一樣,如果不指定圖形的類型,qplot默認(rèn)做出散點(diǎn)圖。對(duì)于給定的x和y向量做散點(diǎn)圖,qplot用法也和plot函數(shù)差不多
> library(ggplot2)
> x <- 1:1000
> y <- rnorm(1000)
> plot(x, y, main="Scatter plot by plot()")
> qplot(x,y, main="Scatter plot by qplot()")


使用數(shù)據(jù)框數(shù)據(jù)
雖然可以直接使用向量數(shù)據(jù),但ggplot2更傾向于使用數(shù)據(jù)框類型的數(shù)據(jù)作圖。使用數(shù)據(jù)框有幾個(gè)好處:數(shù)據(jù)框可以用來存儲(chǔ)數(shù)值、字符串、因子等不同類型等數(shù)據(jù);把數(shù)據(jù)放在同一個(gè)R數(shù)據(jù)框?qū)ο笾锌梢员苊馐褂眠^程中數(shù)據(jù)關(guān)系的混亂;數(shù)據(jù)外觀的整理和轉(zhuǎn)換方便。ggplot2中使用數(shù)據(jù)框作圖的最直接的一個(gè)效果就是:你可以直接用數(shù)據(jù)的分類特性(數(shù)據(jù)框中的列變量)來決定圖形元素的外觀,這個(gè)過程在ggplot2中稱為映射(mapping),是自動(dòng)的。
在演示使用數(shù)據(jù)框作圖的好處之前我們先了解以下ggplot2提供的一組有關(guān)鉆石的示范數(shù)據(jù) diamonds:
> str(diamonds)
Classes ‘tbl_df', ‘tbl' and 'data.frame': 53940 obs. of 10 variables:
$ carat : num 0.23 0.21 0.23 0.29 0.31 0.24 0.24 0.26 0.22 0.23 ...
$ cut : Ord.factor w/ 5 levels "Fair"<"Good"<..: 5 4 2 4 2 3 3 3 1 3 ...
$ color : Ord.factor w/ 7 levels "D"<"E"<"F"<"G"<..: 2 2 2 6 7 7 6 5 2 5 ...
$ clarity: Ord.factor w/ 8 levels "I1"<"SI2"<"SI1"<..: 2 3 5 4 2 6 7 3 4 5 ...
$ depth : num 61.5 59.8 56.9 62.4 63.3 62.8 62.3 61.9 65.1 59.4 ...
$ table : num 55 61 65 58 58 57 57 55 61 61 ...
$ price : int 326 326 327 334 335 336 336 337 337 338 ...
$ x  : num 3.95 3.89 4.05 4.2 4.34 3.94 3.95 4.07 3.87 4 ...
$ y  : num 3.98 3.84 4.07 4.23 4.35 3.96 3.98 4.11 3.78 4.05 ...
$ z  : num 2.43 2.31 2.31 2.63 2.75 2.48 2.47 2.53 2.49 2.39 ...
可以看到這是數(shù)據(jù)框(data.frame)類型,有10個(gè)變量(列),每個(gè)變量有53940個(gè)測(cè)量值(行)。
第一列為鉆石的克拉數(shù)(carat),為數(shù)字型數(shù)據(jù);第二列為鉆石的切工好壞(cut),為因子類型數(shù)據(jù),有5個(gè)水平;第三列為鉆石顏色(color),為7水平的因子;后面還有其他數(shù)據(jù)。
由于數(shù)據(jù)太多,我們只取前7列的100個(gè)隨機(jī)觀測(cè)值。數(shù)據(jù)基本就是我們平時(shí)記錄原始數(shù)據(jù)的樣式:
> set.seed(1000) # 設(shè)置隨機(jī)種子,使隨機(jī)取樣具有可重復(fù)性
> datax<- diamonds[ seq(1,7)]
> head(datax, 4)
##  carat cut color clarity depth table price
## 17686 1.23 Ideal  H  VS2 62.2 55 7130
## 40932 0.30 Ideal  E  SI1 61.7 58 499
## 6146 0.90 Good  H  VS2 61.9 58 3989
## 37258 0.31 Ideal  G VVS1 62.8 57 977
如果要做鉆石克拉和價(jià)格關(guān)系的曲線圖,用plot和qplot函數(shù)都差不多:
plot(x=datax$carat, y=datax$price, xlab="Carat", ylab="Price", main="plot function")
qplot(x=carat, y=price, data=datax, xlab="Carat", ylab="Price", main="qplot function")
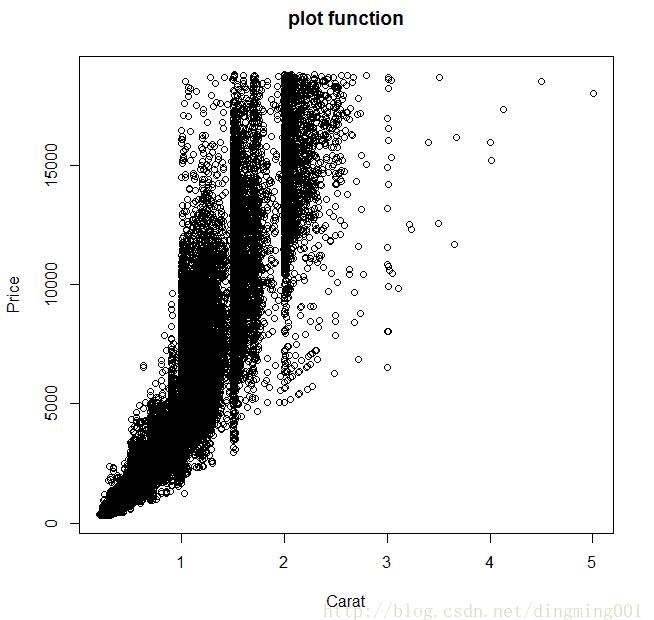

但如果要按切工進(jìn)行分類作圖,plot函數(shù)的處理就復(fù)雜了,你首先得將數(shù)據(jù)進(jìn)行分類提取,然后再一個(gè)個(gè)作圖。雖然可以用循環(huán)完成,但作圖后圖標(biāo)的添加還得非常小心,你得自己保證數(shù)據(jù)和圖形外觀之間的對(duì)應(yīng)關(guān)系:
plot(x=datax$carat, y=datax$price, xlab="Carat", ylab="Price", main="plot function", type='n')
cut.levels <- levels(datax$cut)
cut.n <- length(cut.levels)
for(i in seq(1,cut.n)){
subdatax <- datax[datax$cut==cut.levels[i], ]
points(x=subdatax$carat, y=subdatax$price, col=i, pch=i)
}
legend("topleft", legend=cut.levels, col=seq(1,cut.n), pch=seq(1,cut.n), box.col="transparent", cex=0.8)
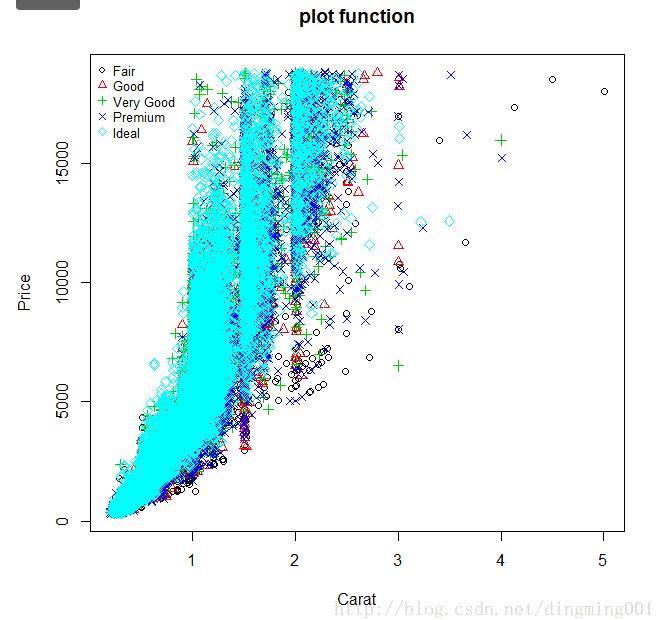
但用ggplot2作圖你需要考慮數(shù)據(jù)分類和圖形元素方面的問題就很少,你只要告訴它用做分類的數(shù)據(jù)就可以了:
qplot(x=carat, y=price, data=datax, color=cut, shape=cut, main="qplot function")

qplot做曲線圖
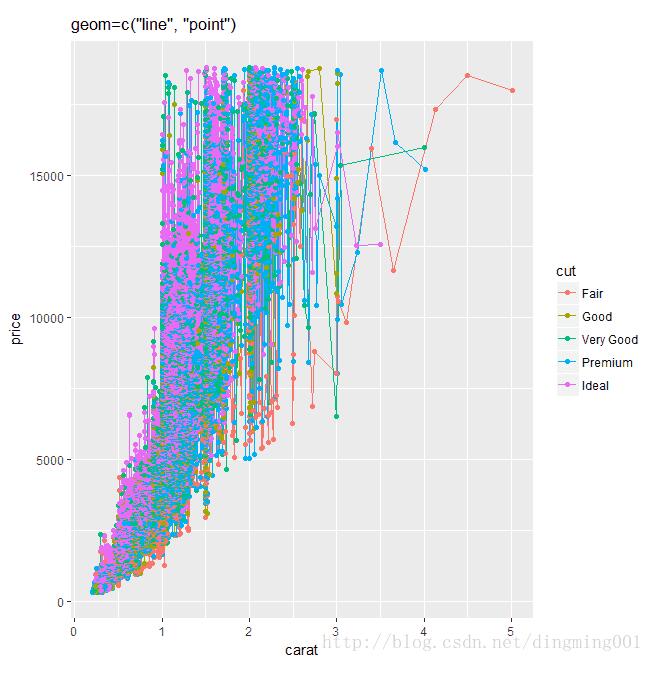
和plot函數(shù)一樣,qplot也可以通過設(shè)置合適的參數(shù)產(chǎn)生曲線圖,這個(gè)參數(shù)就是geom(幾何類型)。圖形的組合非常直接,組合表示幾何類型的向量即可:
qplot(x=carat, y=price, data=datax, color=cut, geom="line", main="geom=\"line\"")
qplot(x=carat, y=price, data=datax, color=cut, geom=c("line", "point"), main="geom=c(\"line\", \"point\")")

以上為個(gè)人經(jīng)驗(yàn),希望能給大家一個(gè)參考,也希望大家多多支持服務(wù)器之家。如有錯(cuò)誤或未考慮完全的地方,望不吝賜教。
原文鏈接:https://blog.csdn.net/dingming001/article/details/72716343


